Veterans in State Legislative Chambers, Snapshot 2020 Edition
American Enterprise Institute
February 24, 2020
Given that one of the most frequent story lines of the 2018 election season focused on military veterans running for political office, military veterans will no doubt be a center of election-watching attention as we head into the 2020 primary season in earnest. And given that a proven pathway to running for office at the national level begins with serving in local and state-level office, now is a perfect time to take stock of the post-2018 electoral fortunes of veterans in state legislatures.
What We Found
The sum of military veterans who joined the ranks of elected politicians across the 50 state legislative chambers declined from their 2016 numbers after the 2018 election season. A still-healthy average of about 12 percent of the state legislatures are currently made up of veterans, down from 14 percent in 2016, which means that veterans continue to participate in elected office at a higher rate than the general population does. Veterans currently make up less than 7 percent of the adult population, with around 18 million living across the United States.
Every state has at least two military veterans in its state legislature, ranging from Utah (two in upper chamber) to New Hampshire (98 across upper and lower chambers). Ten states — California, Illinois, Minnesota, New Jersey, New York, Ohio, Pennsylvania, Vermont, Virginia, and Washington — saw an increase of veterans as legislators in the wake of the 2018 elections. Five states — Idaho, Massachusetts, Missouri, North Dakota, Rhode Island, and Wisconsin — maintained their 2016 numbers. North Dakota has the highest percentage of veterans in its legislature (20 percent). And while the majority of veterans in elected office remain Republican, the 2018 election saw noteworthy shifts across several states toward more Democratic than Republican veterans winning their election, as illustrated in Figure 1. In this, the various veteran elections generally followed 2018 election patterns, as shown in a similar visualization by The Guardian.
Figure 1. US Veterans Serving in the State Legislature: Party Swing from 2016 to 2018
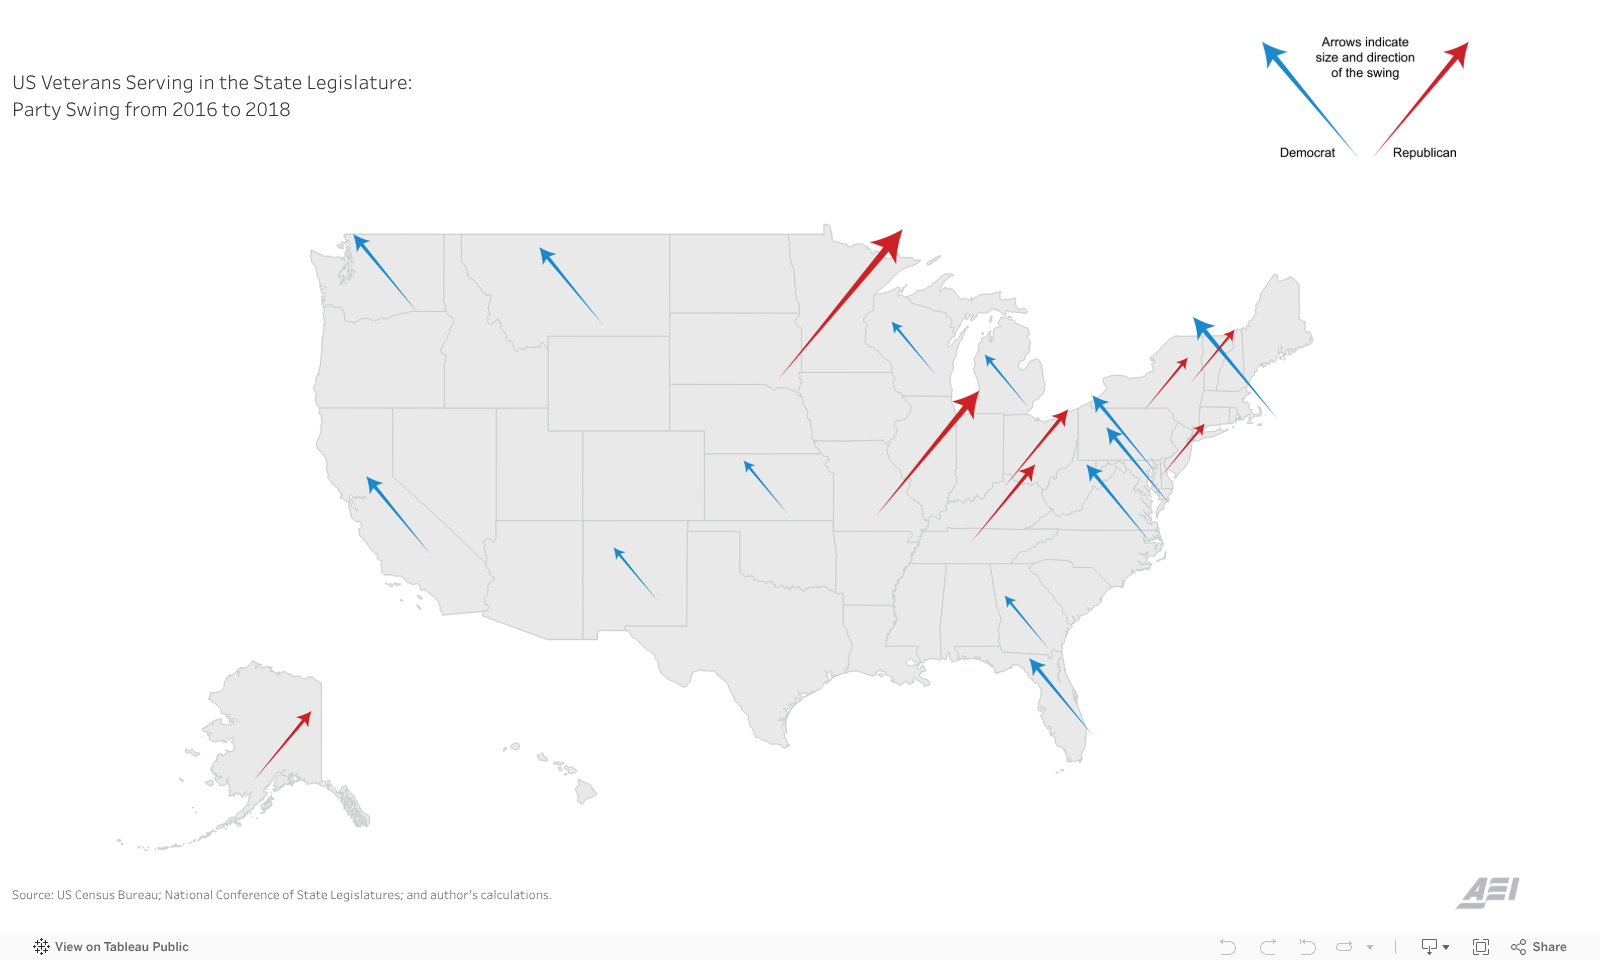
Source: US Census Bureau; National Conference of State Legislatures; and author’s calculations.
Trouble accessing the interactive? View the full Tableau version
Much attention in the 2018 cycle was given to especially female veterans running for elected office as Democrats. It’s noteworthy then that the number of female veterans now in office has grown significantly between 2016 and 2018, perhaps indicating a strong line of future female veteran candidates at the national level. Mirroring their counterparts in the US House of Representatives, female veteran legislators at the state level are much more likely to be Democrats than Republicans, although in general veteran legislators are still about 14 times likelier to be male than female.
We’ve plotted these and several further points of interest in Figure 2. Toggling between the Senate (upper chamber) and House (lower chamber) buttons on the interactive map, you can control for veterans by party, gender, and military service branch. For clarity and user-friendliness, we’ve folded National Guard and Reserve components into their related service branch. Not surprisingly, the Army is well-represented among veteran politicians, followed in descending order by the Air Force, Navy, and Marines and rounded out by the Coast Guard.
Figure 2. US Veterans Serving in State Legislatures: Post 2018 Midterms
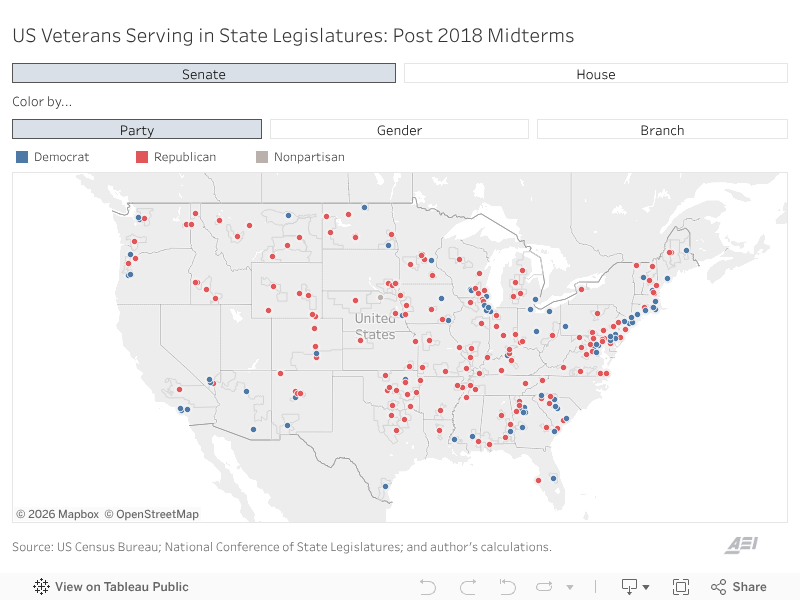
Source: US Census Bureau; National Conference of State Legislatures; and author’s calculations.
Trouble accessing the interactive? View the full Tableau version
Not depicted here but equally of interest, in analyzing the nearly 1,000 veterans currently serving in state legislatures, we found that the percentage of post-9/11 veterans has increased by nearly 10 percent since 2016, with roughly 29 percent of veteran legislators now part of that cohort (though of that percentage, only 12 percent served exclusively after September 11, 2001). Strictly pre-9/11 veterans thus still significantly outnumber post-9/11 veterans in elected office. However, among all state veteran legislators, a minimum of 41 percent have been deployed overseas as part of their service.
In terms of prior political experience, we found that 37.6 percent of known veterans have held elected office before becoming a state representative. Veterans serving in their respective state’s upper chamber most commonly served in their state’s lower chamber, and those serving in the lower chamber most commonly held office previously as county commissioners or councilors. In terms of legislative portfolios once serving in either the upper or lower chamber, in 19 of 50 states, at least half of veteran legislators also serve or have served on their state committee for veterans’ affairs.
What does this all mean? Stayed tuned for more in-depth parsing of the numbers in the weeks ahead!
Note: Elections at the state level are determined by the individual state and do not necessarily follow the midterm and general election cycles that are tracked at the national level. This means that elections, vacancies, and appointments are seemingly continuous throughout the year. We tracked and updated state legislature elections and results from June 2019 through December 2019, and the numbers used here reflect the composition of state legislatures as of December 2019. Each legislator’s military experience was determined solely through publicly available sources.
@media (min-width: 1024px){.post-max-width {padding: 0px !important;}}Related


Second Service: Military Veterans and Public Office
